library(ggplot2)1 R & RStudio
We will be using R via RStudio.
1.1 R: The Language
Released in 1993, R is an opensource successor to S, a commercially available statistical programming language developed at Bell Labs in the 1970s. The history is not particularly relevant. However, understanding that R was originally developed with the explicit goal of teaching introductory statistics (a bit like Matlab) may help to understand some of the design choices made by the developers of R.
There are several attributes that make R useful for teaching statistics:
- R is interpreted
- R is weakly typed
- R’s the focus on data analysis is built into its native data types
- R has strong graphical abilities
Don’t worry if all of these benefits are meaningless to you at this point. We’ll get into the details soon enough. The short version is that the first two bullet points are features that make programmers’ lives easier/more convenient and last two mean that R is ready-made to do data analysis.
There are also a variety of downsides to R, but we will try to sidestep these as much as we can. One way we will do this is by exclusively using packages from the tidyverse. Once you are familiar with one way of working in R, you can explore the many, many alternatives.
1.2 RStudio
The interface between a programmer (or data analyst) and a programming language is often an integrate development environment (IDE), which is just a fancy term for a piece of software that collects a bunch of inter-related tools often useful when programming. We will be using RStudio as our IDE. As the name suggests, RStudio was designed as an R-first IDE, making things easy for those new to R and/or programming.
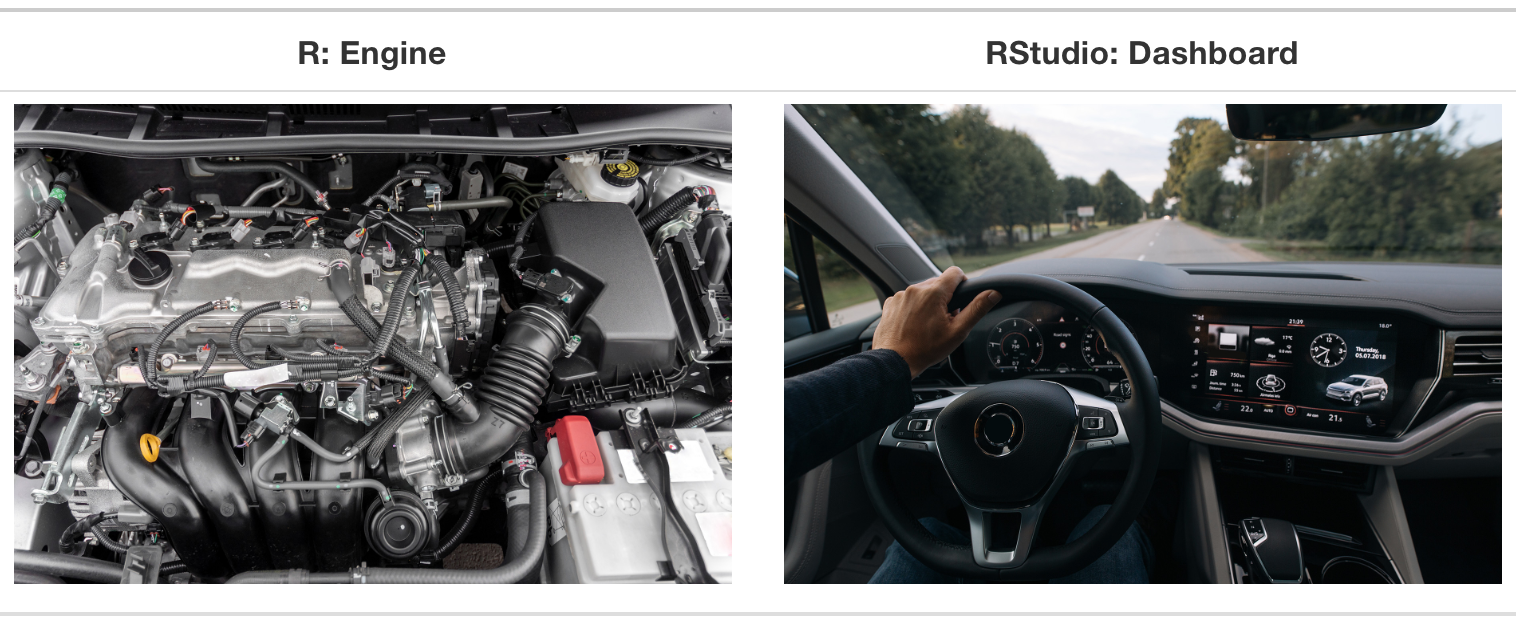
First time users often confuse R and RStudio. At its simplest, R is like a car’s engine while RStudio is like a car’s dashboard as illustrated in Figure Figure 1.1. More precisely, R is the programming language that performs computations and RStudio is how users interact with R.
1.3 Installation
Installation involves two major steps. The first step is to install R itself. You can get the most recent version from CRAN (the comprehensive R archive network): https://cloud.r-project.org. There are ready-made installers available for Linux, macOS, and Windows.
The second step is to install RStudio. You can download it from Posit: https://posit.co/download/rstudio-desktop/. Again, there are versions available for all major platforms.
1.4 Using R via RStudio
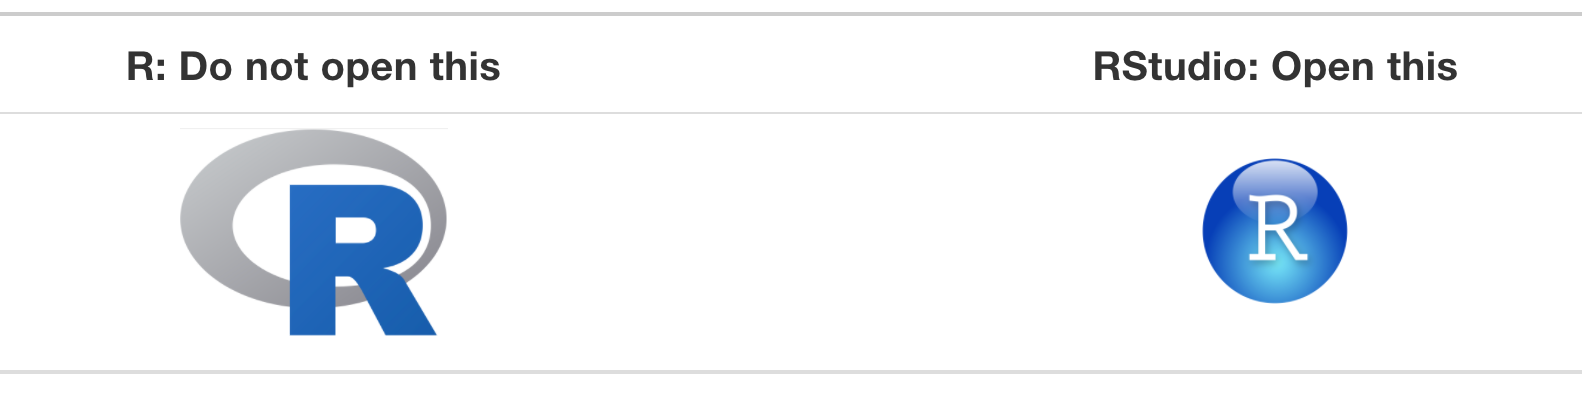
Recall our car analogy from earlier. Much as we don’t drive a car by interacting directly with the engine but rather by interacting with elements on the car’s dashboard, we won’t be using R directly but rather we will use RStudio’s interface. After you install R and RStudio on your computer, you’ll have two new programs or applications you can open. We’ll always work in RStudio and not in the R application. Figure Figure 1.2 shows what icon you should be clicking on your computer.
After you open RStudio, you should see something similar to Figure Figure 1.3. (Note that slight differences might exist if the RStudio interface is updated after 2019 to not be this by default.)
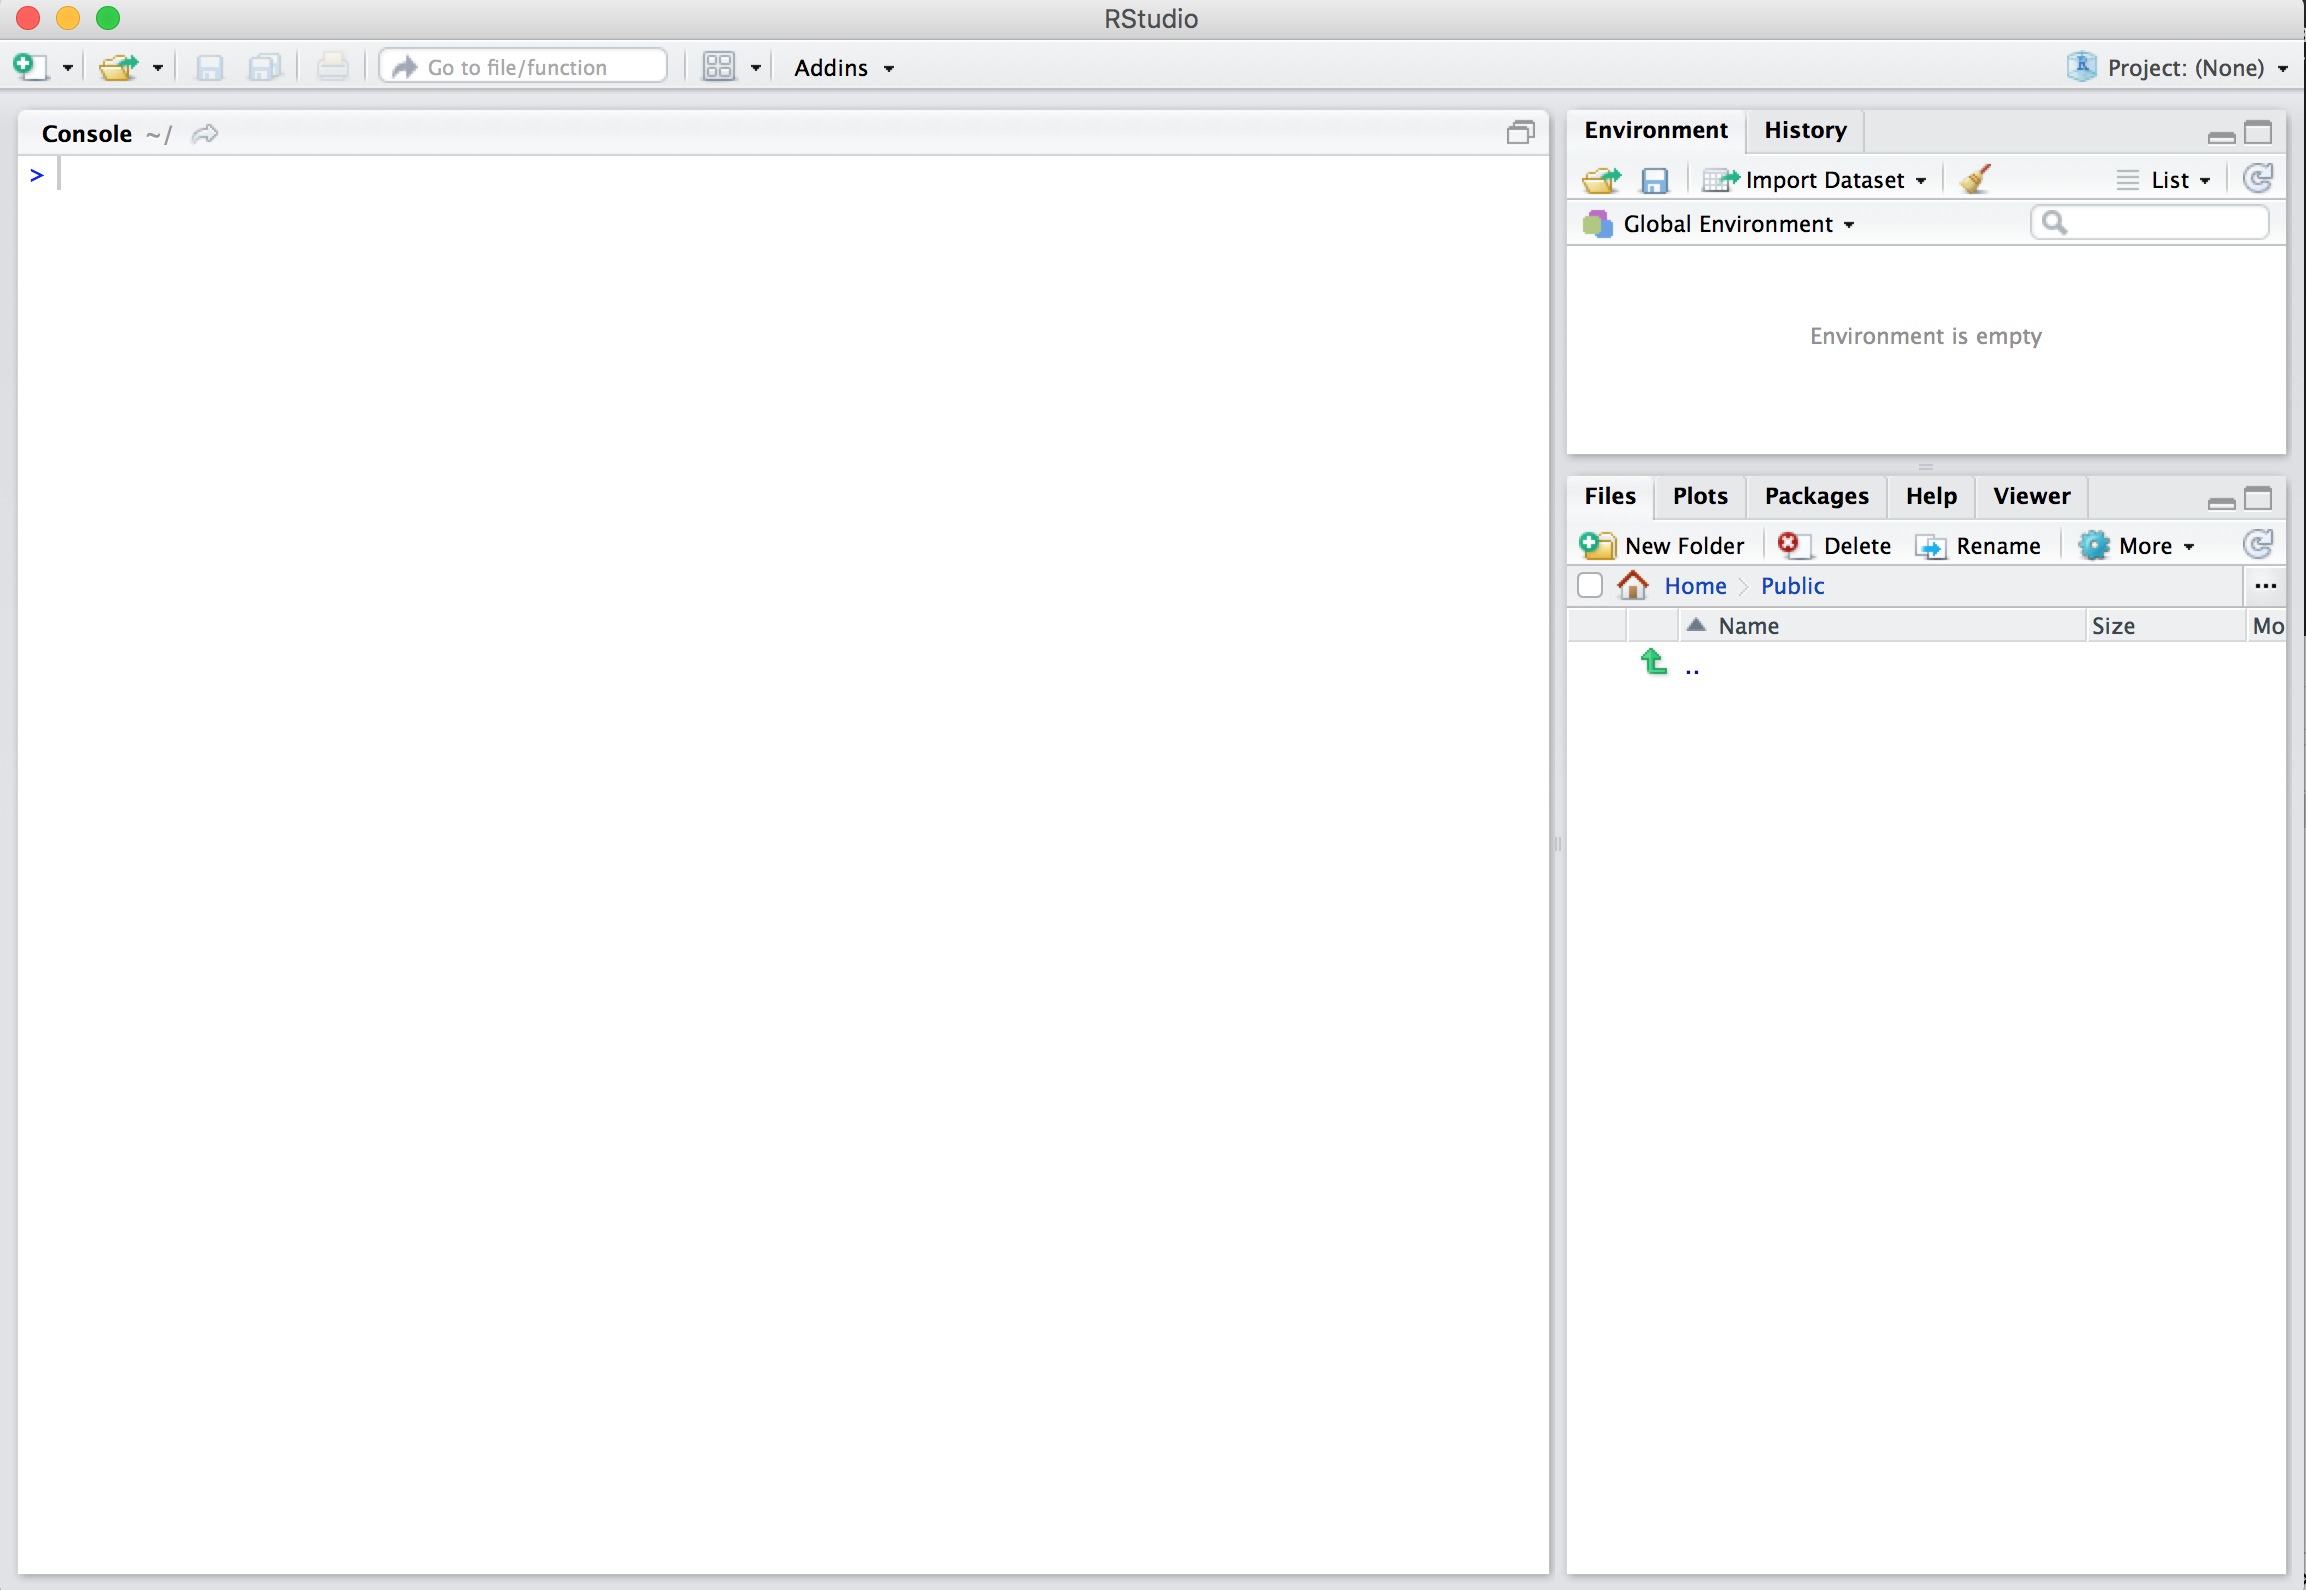
Note the three panes dividing the screen: the console pane, the files pane, and the environment pane. The console pane is where you enter R commands and R returns the corresponding results (and/or error messages if you make a mistake). We’ll dig into the other panes a bit more later.
1.5 Other Packages
One of the main strengths of R (arguably the most important strength) is the availability of many, many packages (or libraries) that extend the functionality of R in all sort of different ways. These libraries are written by a worldwide community of R users and can be downloaded for free. We will rely on a variety of these packages, so we take a moment now to discuss how packages work in R and RStudio.
A good analogy for R packages is they are like apps you can download onto your mobile phone. So R is like a new mobile phone: while it has a certain amount of features when you use it for the first time, it doesn’t have everything. R packages are like the apps you can download onto your phone from Apple’s App Store or Android’s Google Play.
Let’s continue this analogy by considering the Instagram app for editing and sharing pictures. Say you have purchased a new phone and you would like to share a photo you have just taken with friends on Instagram. You need to:
- Install the app: Since your phone is new and does not include the Instagram app, you need to download the app from either the App Store or Google Play. You do this once and you’re set for the time being. You might need to do this again in the future when there is an update to the app.
- Open the app: After you’ve installed Instagram, you need to open it.
Once Instagram is open on your phone, you can then proceed to share your photo with your friends and family. The process is very similar for using an R package. You need to:
- Install the package: This is like installing an app on your phone. Most packages are not installed by default when you install R and RStudio. Thus, if you want to use a package, you need to install it first. Once you’ve installed a package, you likely won’t install it again unless you want to update it to a newer version.
- “Load” the package: “Loading” a package is like opening an app on your phone. Packages are not “loaded” by default when you start RStudio on your computer; you need to “load” each package you want to use every time you start RStudio.
Let’s take a look at how these two steps come together to install and load the ggplot2 package for data visualization.
1.5.1 Package Installation
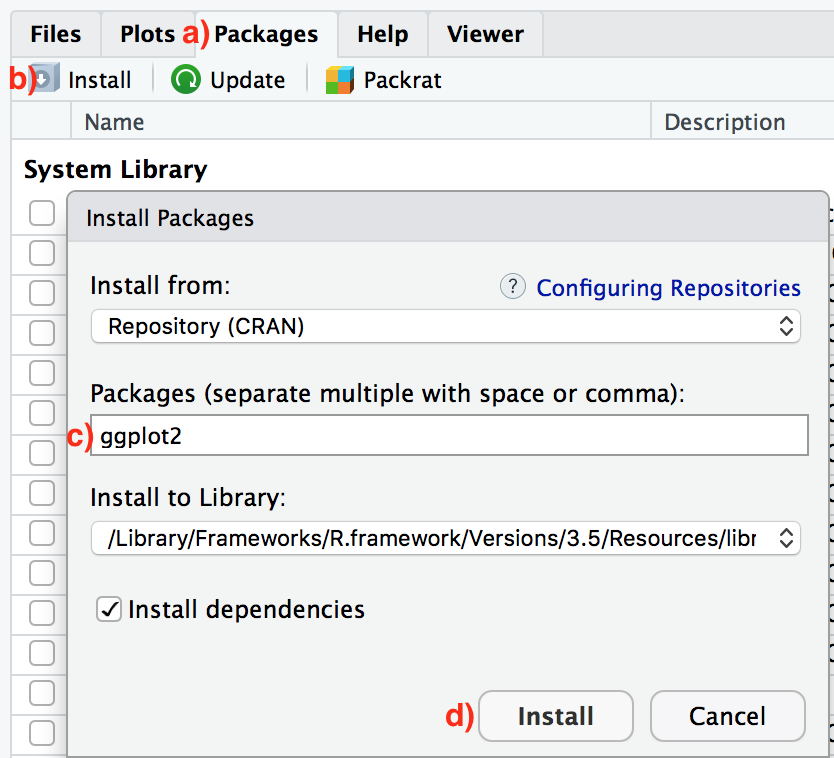
There are two ways to install an R package: an easy way and a more advanced way. Let’s install the ggplot2 package the easy way first as shown in Figure Figure 1.4. In the Files pane of RStudio:
- Click on the “Packages” tab.
- Click on “Install” next to Update.
- Type the name of the package under “Packages (separate multiple with space or comma):” In this case, type
ggplot2. - Click “Install.”
An alternative but slightly less convenient way to install a package is by typing install.packages("ggplot2") in the console pane of RStudio and pressing Return/Enter on your keyboard. Note you must include the quotation marks around the name of the package.
Much like an app on your phone, you only have to install a package once. However, if you want to update a previously installed package to a newer version, you need to reinstall it by repeating the earlier steps.
1.5.2 Package Loading
Recall that after you’ve installed a package, you need to “load it.” In other words, you need to “open it.” We do this by using the library() command.
For example, to load the ggplot2 package, run the following code in the console pane. What do we mean by “run the following code”? Either type or copy-and-paste the following code into the console pane and then hit the Enter key.
If after running the earlier code, a blinking cursor returns next to the > “prompt” sign, it means you were successful and the ggplot2 package is now loaded and ready to use. If, however, you get a red “error message” like this:
Error in library(ggplot2) : there is no package called ‘ggplot2’it means that you didn’t successfully install it. If you get this error message, go back to Subsection Section 1.5.1 on R package installation and make sure to install the ggplot2 package before proceeding.
1.5.3 Package Use
One very common mistake new R users make when wanting to use particular packages is they forget to “load” them first by using the library() command we just saw. Remember: you have to load each package you want to use every time you start RStudio. If you don’t first “load” a package, but attempt to use one of its features, you’ll see an error message similar to:
Error: could not find functionThis is a different error message than the one you just saw on a package not having been installed yet. R is telling you that you are trying to use a function in a package that has not yet been “loaded.” R doesn’t know where to find the function you are using. Almost all new users forget to do this when starting out, and it is a little annoying to get used to doing it. However, you’ll remember with practice and after some time it will become second nature for you.
1.6 Quitting R
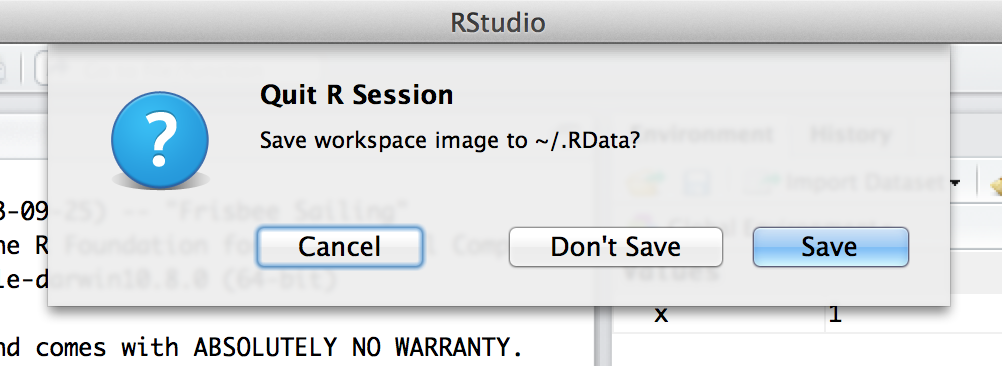
There’s one last thing I should cover in this chapter: how to quit R. You can just shut down the application in the normal way (e.g., File->Quit Session). However, R also has a function, q(), that you can use to quit, which can be handy. Regardless of what method you use to quit R, when you do so for the first time R will probably ask you if you want to save the “workspace image”. We’ll talk a lot more about loading and saving data in Chapter 4, but I figured we’d better quickly cover this now otherwise you’re going to get annoyed when you close R at the end of the chapter. If you’re using RStudio, you’ll see a dialog box that looks like the one shown in Figure @ref(fig:quitR). If you’re using a text based interface you’ll see this:
q()

## Save workspace image? [y/n/c]:
The y/n/c part here is short for “yes / no / cancel”. Type y if you want to save, n if you don’t, and c if you’ve changed your mind and you don’t want to quit after all.
What does this actually mean? What’s going on is that R wants to know if you want to save all those variables that you’ve been creating, so that you can use them later. This sounds like a great idea, so it’s really tempting to type y or click the “Save” button. To be honest though, I very rarely do this, and it kind of annoys me a little bit.. what R is really asking is if you want it to store these variables in a “default” data file, which it will automatically reload for you next time you open R. And quite frankly, if I’d wanted to save the variables, then I’d have already saved them before trying to quit. Not only that, I’d have saved them to a location of my choice, so that I can find it again later. So I personally never bother with this.
In fact, every time I install R on a new machine one of the first things I do is change the settings so that it never asks me again. You can do this in RStudio really easily: use the menu system to find the RStudio option; the dialog box that comes up will give you an option to tell R never to whine about this again (see Figure 1.5). On a Mac, you can open this window by going to the “RStudio” menu and selecting “Preferences”. On a Windows machine you go to the “Tools” menu and select “Global Options”. Under the “General” tab you’ll see an option that reads “Save workspace to .Rdata on exit”. By default this is set to “ask”. If you want R to stop asking, change it to “never”.
1.7 Exercises
- Install both R and RStudio using the instructions found in Section 1.3
- Open RStudio
- Settings
- Go to “Tools” menu and select “Global Options…”. On the “General” tab, uncheck the box that says “Restore .RData into workspace at startup”.
- Set the “Save workspace to .Rdata on exit” option to “never”.
- Install the
tidyversepackage using the instructions found in Section 1.5.1 - Verify installation of the tidyverse package by loading the package using the instructions found in Section 1.5.2
- Create a directory/folder somewhere convenient on your hard drive and name it “statslab”
- Set the “working directory” for R by going to “Session” menu and selecting “Set Working Directory” and then “Choose Directory…”. Select the “statslab” directory/folder you just created.
- Any time you wish to begin (or return to) work for this course, perform this step so that all of your file (data, scripts, etc.) are saved in a central location. Future activities will provide further instruction assuming that you a) have created this directory/folder and b) have set it to be your working directory in RStudio.