| Date | Boeing stock price | Amazon stock price | Google stock price |
|---|---|---|---|
| 2009-01-01 | $173.55 | $174.90 | $174.34 |
| 2009-01-02 | $172.61 | $171.42 | $170.04 |
5 The Tidyverse
From here out on we will be utilizing a set of inter-related packages collectively known as the “tidyverse”. These packages share conventions and revolve around a specific flavor of dataframe (known as a “tibble”) which stores data in a specific format (the “tidy” format, described below). This standardization of input and output makes transitions between different functions within the different tidyverse packages relatively seamless. For more information, check out the tidyverse.org webpage for the package. In this chapter, we cover what the tidyverse libraries are, how to install them, and how to load them.
5.1 “Tidy” data
Let’s now learn about the concept of “tidy” data format.
5.1.1 Definition of “tidy” data
You have surely heard the word “tidy” in your life:
- “Tidy up your room!”
- “Write your homework in a tidy way so it is easier to provide feedback.”
- Marie Kondo’s best-selling book, The Life-Changing Magic of Tidying Up: The Japanese Art of Decluttering and Organizing, and Netflix TV series Tidying Up with Marie Kondo.
- “I am not by any stretch of the imagination a tidy person, and the piles of unread books on the coffee table and by my bed have a plaintive, pleading quality to me - ‘Read me, please!’” - Linda Grant
What does it mean for your data to be “tidy”? While “tidy” has a clear English meaning of “organized,” the word “tidy” in data science using R means that your data follows a standardized format. We will follow Hadley Wickham’s definition of “tidy” data:
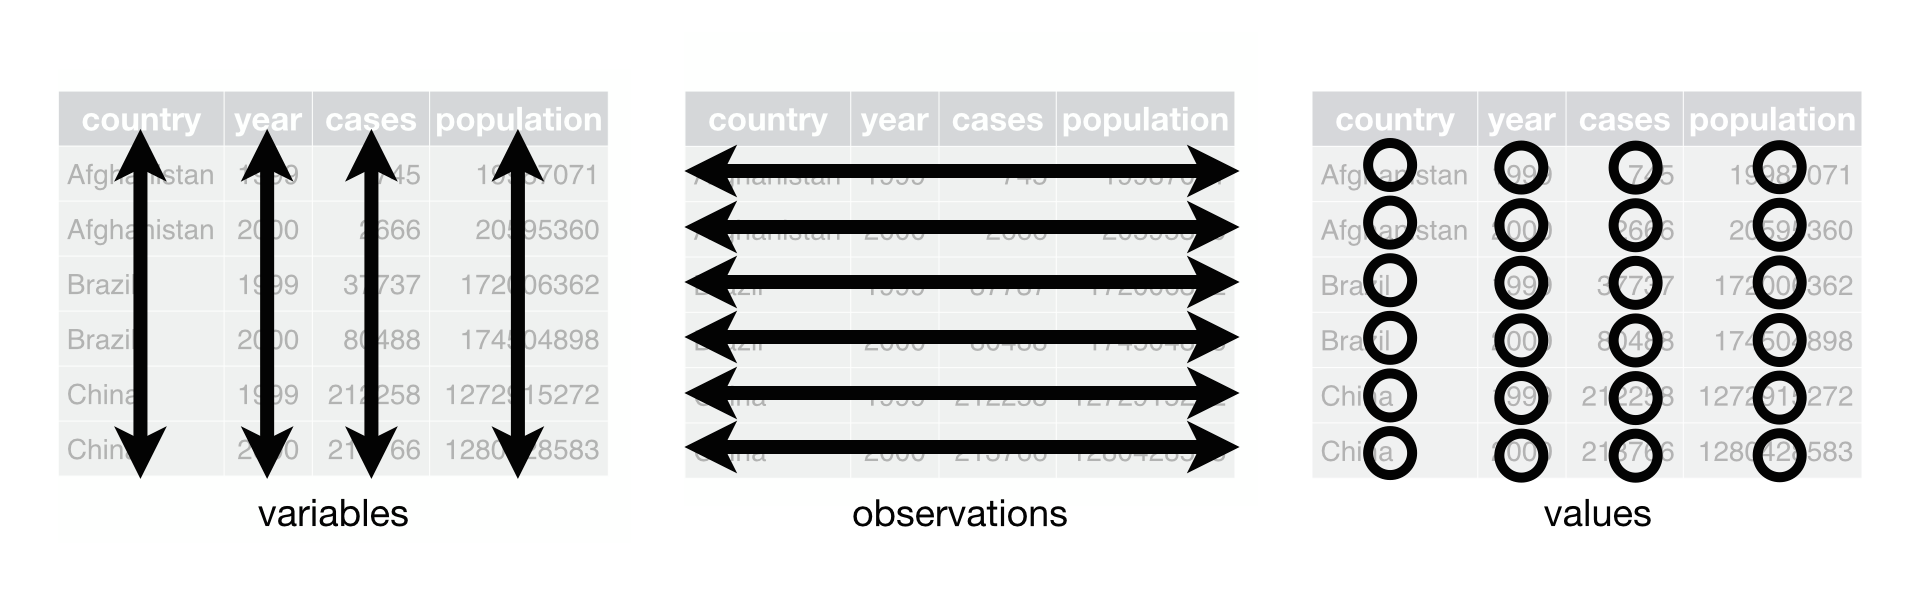
A dataset is a collection of values, usually either numbers (if quantitative) or strings AKA text data (if qualitative/categorical). Values are organised in two ways. Every value belongs to a variable and an observation. A variable contains all values that measure the same underlying attribute (like height, temperature, duration) across units. An observation contains all values measured on the same unit (like a person, or a day, or a city) across attributes.
“Tidy” data is a standard way of mapping the meaning of a dataset to its structure. A dataset is messy or tidy depending on how rows, columns and tables are matched up with observations, variables and types. In tidy data:
- Each variable forms a column.
- Each observation forms a row.
- Each type of observational unit forms a table.
For example, say you have the following table of stock prices:
Although the data are neatly organized in a rectangular spreadsheet-type format, they do not follow the definition of data in “tidy” format. While there are three variables corresponding to three unique pieces of information (date, stock name, and stock price), there are not three columns. In “tidy” data format, each variable should be its own column. Notice that both tables present the same information, but in different formats.
| Date | Stock Name | Stock Price |
|---|---|---|
| 2009-01-01 | Boeing | $173.55 |
| 2009-01-01 | Amazon | $174.90 |
| 2009-01-01 | $174.34 | |
| 2009-01-02 | Boeing | $172.61 |
| 2009-01-02 | Amazon | $171.42 |
| 2009-01-02 | $170.04 |
Now we have the requisite three columns Date, Stock Name, and Stock Price. On the other hand, consider this data:
| Date | Boeing Price | Weather |
|---|---|---|
| 2009-01-01 | $173.55 | Sunny |
| 2009-01-02 | $172.61 | Overcast |
In this case, even though the variable “Boeing Price” occurs just like in our non-“tidy” data, the data is “tidy” since there are three variables corresponding to three unique pieces of information: Date, Boeing price, and the Weather that particular day.
5.2 tidyverse package
The following four packages, which are among four of the most frequently used R packages for data science, will be heavily used throughout the book: ggplot2, dplyr, readr, and tidyr.
The ggplot2 package is for data visualization, dplyr is for data wrangling, readr is for importing CSV files into R (we used it in Section 4.1.1), and tidyr is for converting data to “tidy” format. There is a much quicker way to load these packages than by individually loading them: by installing and loading the tidyverse package. The tidyverse package acts as an “umbrella” package whereby installing/loading it will install/load multiple packages at once for you.
After installing the tidyverse package as you would a normal package (see Section 1.5), running:
library(tidyverse)accomplishes the the same things as running:
library(ggplot2)
library(dplyr)
library(readr)
library(tidyr)
library(purrr)
library(tibble)
library(stringr)
library(forcats)
For the remainder of this book, we’ll start every chapter by running library(tidyverse) instead of loading the various component packages individually. The tidyverse “umbrella” package gets its name from the fact that all the functions in all its packages are designed to have common inputs and outputs: data frames that are in “tidy” format. This standardization of input and output makes transitions between different functions in the different packages as seamless as possible. For more information (including the more advanced packages, purrr, tibble, stringr, and forcats), check out the tidyverse.org webpage for the package and the book ggplot2: Elegant Graphics ofr Data Analysis.
5.3 tidymodels package
In addition to the packages listed above, there are also a variety of packages that live in a sort of “extended” tidyverse. These include packages such as lubridate (for handling dates and times) and magrittr (providing pipe operators). One particularly useful package is modelr which is used for for creating analysis pipelines. However, the modelr package has been superseded by a collection of packages called tidymodels. Like tidyverse, tidymodels is an umbrella package encapsulating: rsample, parsnip, recipes, broom and other packages designed to facilitate machine learning-style data analysis. We will make particular use of a package called infer, which provides a high-level interface for performing statistical inference. For more information, check out www.tidymodels.org and the book Tidy Modeling with R.
5.4 Exercises
- Open RStudio
- If you have not done so already, install the
tidyversepackage using the instructions found in Section 1.5.1 - Verify installation of the tidyverse package by loading the package using the instructions found in Section 1.5.2
- Check out all the cheatsheets available for tidyverse package by going to the Help menu and selecting “Cheat Sheets”. You can look over the
readrcheat sheet for now, but remember this resource as we will be diving into the other tidyverse packages (e.g.,dplyr,ggplot2) in future chapters.